CsfWebChart » History » Version 5
Wil van Antwerpen, 04/08/2025 12:33 PM
| 1 | 1 | Wil van Antwerpen | # CsfWebChart |
|---|---|---|---|
| 2 | |||
| 3 | ## Line Chart Demo |
||
| 4 | |||
| 5 | 5 | Wil van Antwerpen | 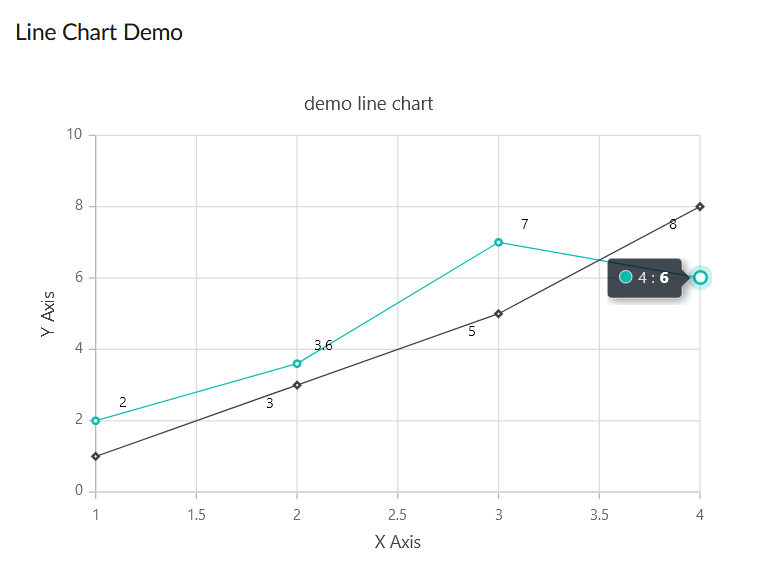 |
| 6 | 1 | Wil van Antwerpen | |
| 7 | The DataFlex code for the above looks like |
||
| 8 | |||
| 9 | ~~~ text |
||
| 10 | |||
| 11 | 2 | Wil van Antwerpen | Object oWebChart is a csfWebChart |
| 12 | Set piHeight to 400 |
||
| 13 | Set piColumnSpan to 12 |
||
| 14 | Set psTitle to "demo line chart" |
||
| 15 | Set pbTooltip to True |
||
| 16 | Object oXAxis is a csfWebChartAxis |
||
| 17 | Set peAxisType to chartAxisX |
||
| 18 | Set psTitle to "X Axis" |
||
| 19 | End_Object |
||
| 20 | Object oYAxis is a csfWebChartAxis |
||
| 21 | Set peAxisType to chartAxisY |
||
| 22 | Set psTitle to "Y Axis" |
||
| 23 | End_Object |
||
| 24 | 1 | Wil van Antwerpen | Object oFirstSeries is a csfWebChartSeries |
| 25 | 2 | Wil van Antwerpen | Object oFirstMarkers is a csfWebChartMarker |
| 26 | 1 | Wil van Antwerpen | Set pbVisible to True |
| 27 | 2 | Wil van Antwerpen | Object oFirstDataLabel is a csfWebChartDataLabel |
| 28 | 1 | Wil van Antwerpen | Set pbVisible to True |
| 29 | Set psPosition to "Top" |
||
| 30 | Set psAlignment to "Near" |
||
| 31 | End_Object |
||
| 32 | End_Object |
||
| 33 | Procedure OnAddChartData |
||
| 34 | Send AddPoint 1 2 |
||
| 35 | Send AddPoint 2 3.6 |
||
| 36 | Send AddPoint 3 7 |
||
| 37 | Send AddPoint 4 6 |
||
| 38 | End_Procedure |
||
| 39 | End_Object |
||
| 40 | Object oSecondSeries is a csfWebChartSeries |
||
| 41 | 2 | Wil van Antwerpen | Object oSecondMarkers is a csfWebChartMarker |
| 42 | 1 | Wil van Antwerpen | Set pbVisible to True |
| 43 | Set psShape to "Diamond" |
||
| 44 | 2 | Wil van Antwerpen | Object oSecondDataLabel is a csfWebChartDataLabel |
| 45 | 1 | Wil van Antwerpen | Set pbVisible to True |
| 46 | Set psPosition to "Bottom" |
||
| 47 | Set psAlignment to "Far" |
||
| 48 | End_Object |
||
| 49 | End_Object |
||
| 50 | Procedure OnAddChartData |
||
| 51 | Send AddPoint 1 1 |
||
| 52 | Send AddPoint 2 3 |
||
| 53 | Send AddPoint 3 5 |
||
| 54 | Send AddPoint 4 8 |
||
| 55 | End_Procedure |
||
| 56 | End_Object |
||
| 57 | End_Object |
||
| 58 | |||
| 59 | 2 | Wil van Antwerpen | |
| 60 | 1 | Wil van Antwerpen | ~~~ |
| 61 | |||
| 62 | The Series object has your data. |
||
| 63 | There are markers (the diamond shapes and the dots) to indicate your data point. |
||
| 64 | There's also a DataLabel to display the actual value of your data point. |
||
| 65 | |||
| 66 | You put the marker object in your series object and customize that… then if you want to do something specific with the dataLabel you add a datalabel object in that and tweak the settings for it. |
||
| 67 | DataLabel as well as Marker objects are both optional. |
||
| 68 | |||
| 69 | This pretty much matches the JSON object definitions as is documented over at SyncFusion. |
||
| 70 | |||
| 71 | |||
| 72 | |||
| 73 | |||
| 74 | ## Bar Chart Demo |
||
| 75 | |||
| 76 | 5 | Wil van Antwerpen | 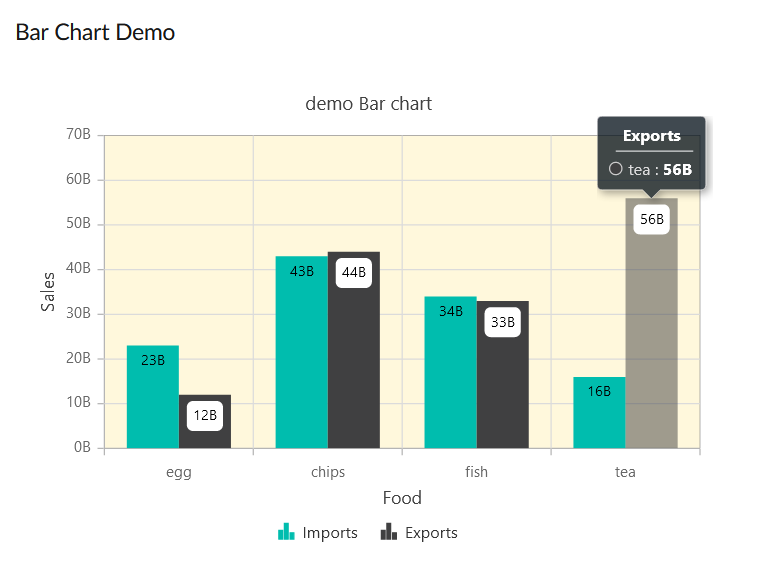 |
| 77 | 1 | Wil van Antwerpen | |
| 78 | The DataFlex code looks like: |
||
| 79 | |||
| 80 | ~~~ text |
||
| 81 | |||
| 82 | 2 | Wil van Antwerpen | Object oWebBarChart is a csfWebChart |
| 83 | Set piHeight to 400 |
||
| 84 | Set piColumnSpan to 12 |
||
| 85 | Set psTitle to "demo Bar chart" |
||
| 86 | Set pbTooltip to True |
||
| 87 | Object oXAxis is a csfWebChartAxis |
||
| 88 | Set peAxisType to chartAxisX |
||
| 89 | Set psTitle to "Food" |
||
| 90 | Set psValueType to "Category" |
||
| 91 | End_Object |
||
| 92 | Object oYAxis is a csfWebChartAxis |
||
| 93 | Set peAxisType to chartAxisY |
||
| 94 | Set psTitle to "Sales" |
||
| 95 | Set psLabelFormat to "{value}B" |
||
| 96 | End_Object |
||
| 97 | Object oBarArea is a csfWebChartArea |
||
| 98 | Set psBackground to "cornSilk" |
||
| 99 | //Set psBorderColor to "green" |
||
| 100 | //Set piBorderWidth to 2 |
||
| 101 | End_Object |
||
| 102 | Object oFirstSeries is a csfWebChartSeries |
||
| 103 | //Set psType to "Bar" |
||
| 104 | Set psType to "Column" |
||
| 105 | Set psName to "Imports" |
||
| 106 | Object oFirstMarkers is a csfWebChartMarker |
||
| 107 | Object oFirstDataLabel is a csfWebChartDataLabel |
||
| 108 | Set pbVisible to True |
||
| 109 | Set psPosition to "Top" |
||
| 110 | End_Object |
||
| 111 | End_Object |
||
| 112 | Procedure OnAddChartData |
||
| 113 | Send AddPoint "egg" 23 |
||
| 114 | Send AddPoint "chips" 43 |
||
| 115 | Send AddPoint "fish" 34 |
||
| 116 | Send AddPoint "tea" 16 |
||
| 117 | End_Procedure |
||
| 118 | End_Object |
||
| 119 | Object oSecondSeries is a csfWebChartSeries |
||
| 120 | //Set psType to "Bar" |
||
| 121 | Set psType to "Column" |
||
| 122 | Set psName to "Exports" |
||
| 123 | Object oSecondMarkers is a csfWebChartMarker |
||
| 124 | Object oSecondDataLabel is a csfWebChartDataLabel |
||
| 125 | Set pbVisible to True |
||
| 126 | Set psPosition to "Top" |
||
| 127 | Set psFill to "White" |
||
| 128 | End_Object |
||
| 129 | End_Object |
||
| 130 | Procedure OnAddChartData |
||
| 131 | Send AddPoint "egg" 12 |
||
| 132 | Send AddPoint "fish" 33 |
||
| 133 | Send AddPoint "chips" 44 |
||
| 134 | Send AddPoint "tea" 56 |
||
| 135 | End_Procedure |
||
| 136 | End_Object |
||
| 137 | End_Object |
||
| 138 | |||
| 139 | |||
| 140 | 1 | Wil van Antwerpen | ~~~ |
| 141 | 2 | Wil van Antwerpen | |
| 142 | If you set psType to "Bar' then you have a horizontal bar chart. |
||
| 143 | If you set psType to "Column" you'll get the vertical bar chart like in the picture above. |
||
| 144 | 3 | Wil van Antwerpen | |
| 145 | |||
| 146 | ## Direct SyncFusion Links |
||
| 147 | |||
| 148 | Documentation for the API is here: |
||
| 149 | |||
| 150 | * https://ej2.syncfusion.com/documentation/api/chart/ |
||
| 151 | |||
| 152 | Tips & tricks here: |
||
| 153 | |||
| 154 | * https://ej2.syncfusion.com/javascript/documentation/chart/es5-getting-started/ |
||
| 155 | |||
| 156 | SyncFusion Chart control demo: |
||
| 157 | |||
| 158 | 4 | Wil van Antwerpen | * https://ej2.syncfusion.com/javascript/demos/#/fluent2/chart/line.html |